

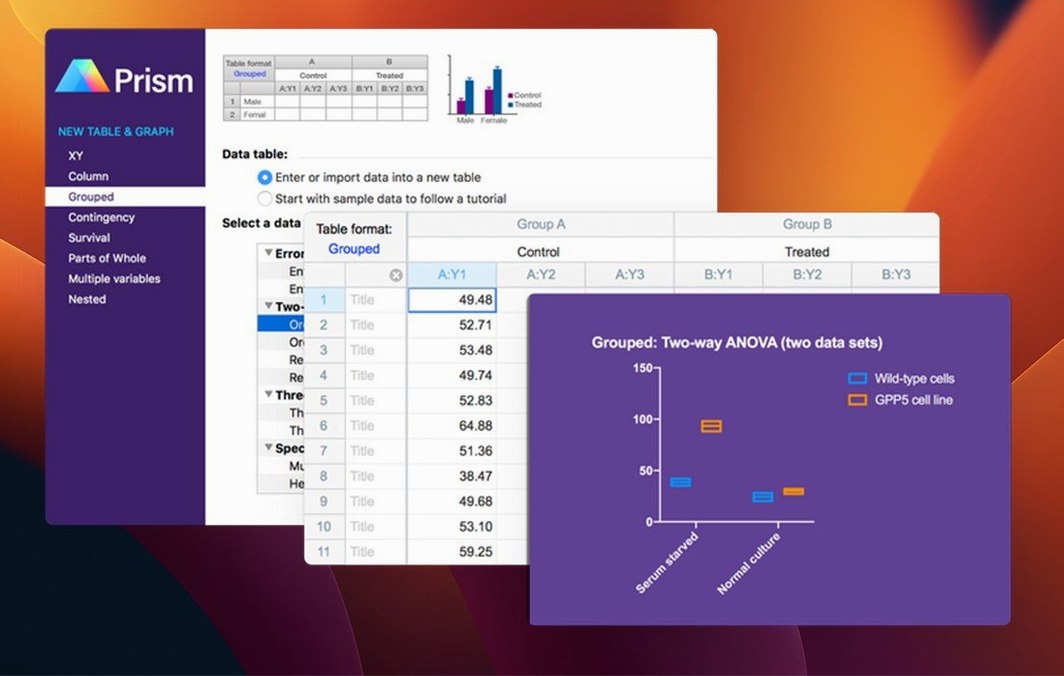
GraphPad Prism is a Mac application that brings biostatistics, nonlinear regression, and scientific graphing into one workspace, with the current 11.1.0 release running natively on Apple Silicon and Intel 64-bit machines.
- Variable selection in analysis dialogs — version 11.1.0 cleans up how you pick variables for t tests, multifactor ANOVA, nonlinear regression, and simple survival analysis.
- Statistical test guidance — built-in tools help you choose an appropriate test and make sense of the output rather than leaving you with a pile of p-values.
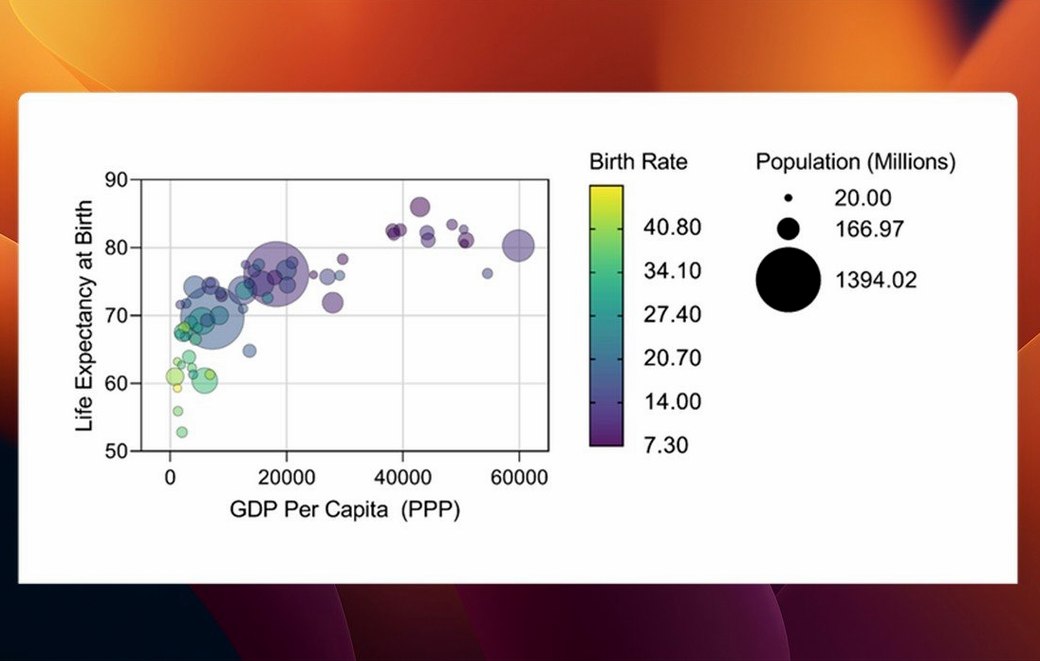
- New graph types for multiple variables tables — useful when a single experiment produces several related measurements that need to sit side by side.
- Categorical level ordering — gives you control over how groups appear on graphs and in results, which matters more than it sounds once you present data to others.
- More than 60 bug fixes — the kind of release that rewards experienced users who have lived with small annoyances for a while.
The workflow improvements build on familiar functions instead of replacing them, so long-time users can adopt the new pieces gradually while keeping their existing analysis habits intact.
Turn on autosave and build a sandbox project before touching real data
Prism rewards a little setup time. The first thing I’d do is open Preferences and check the file-saving behavior — autosave has saved me more than once when I got pulled away mid-analysis. Then I’d create one small practice project with a multiple variables table, just to see how the new graph types behave before committing real experimental data to them.
Two habits I’d build early:
- Name your data tables and results sheets as you go. Prism keeps everything in one project file, and six months later “Data 4” tells you nothing.
- Use the Notes section on each sheet. A line about which batch or what condition the numbers came from takes seconds now and prevents confusion later.
Tip: if you work with collaborators who send you data in different formats, spend one afternoon learning how Prism handles imports from CSV and Excel files. It’s the kind of small thing that makes the first week feel less bumpy.
Graph redraws finish before I reach for my phone on Apple Silicon
On a modern Apple Silicon Mac, Prism 11.1.0 feels snappy — graph redraws and analysis runs happen quickly enough that I don’t reach for my phone while waiting. On older Intel machines it’s less breezy, but still perfectly usable for typical data sets. The 60-plus bug fixes in this release show up as fewer small glitches: fewer mystery dialog behaviors, cleaner sheet switching, smoother scrolling through long results tables.
Memory use is modest for what the software does. A project with several data tables, analyses, and a dozen graphs stays well within what a standard Mac handles easily. That said, if you keep many projects open at once while also running a browser with forty tabs, you’ll notice the usual macOS memory pressure. Closing finished projects keeps things comfortable.
Stability has been good in daily use. I’ve had no crashes with 11.1.0 on Apple Silicon, and the few times I expected trouble — a big nonlinear regression on a messy data set — Prism just worked through it. It’s the kind of quiet reliability you want in software you depend on for publication figures.
When the t-test dialog expects your data arranged the other way
The most frequent frustration I hear about is variable selection: when you’ve set up a data table one way, but the t test or ANOVA dialog expects the data another way. The streamlined variable selection in 11.1.0 helps, but the real fix is understanding how Prism sees your table layout. If a dialog looks confusing, go back to the data table and check whether each column is set as a Y value, an X value, or a grouping variable. That one change resolves most “why is this grayed out?” moments.
Another snag: graph types that don’t fit your data. The new multiple variables graph types are handy, but if your table isn’t structured the way the graph expects, Prism will offer only a subset of graph options. Reorganize the table, and the graph options change. Sometimes people think the software is limited when really it’s the table shape.
If a graph looks wrong — wrong colors, missing legend entries, odd axis labels — I’d first check the sheet’s graph settings rather than starting over. Prism remembers formatting per graph, so a small change in one place can ripple. The “Format Graph” dialog is your friend. And if a project file ever behaves oddly after an update, a quick “Save As” to a fresh file clears up stale temp settings more often than you’d expect.
Picking up last week’s ELISA titration project on a Tuesday afternoon
Here’s how a session might go for me on a Tuesday afternoon, with a stack of ELISA results waiting.
I open my project file from last week, the one with all the titration experiments. The autosave message doesn’t pop up, which means everything is as I left it. I create a new data table for today’s plate, paste in the absorbance values, and tell Prism which rows are standards and which are samples. So far, so calm.
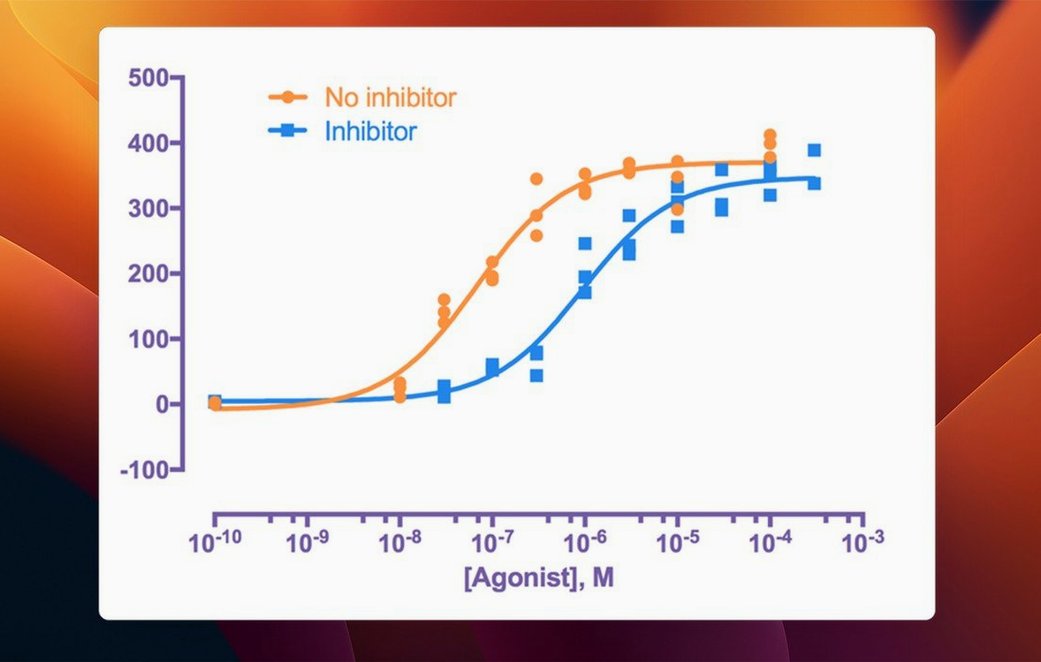
Next, I run the standard curve: nonlinear regression, four-parameter logistic. The dialog now lets me select variables with fewer clicks, which I appreciate when I’m doing this three times per plate. The results sheet appears with the curve parameters, R², and the fitted curve on a graph. I glance at the residual plot — a habit from a past mistake — and move on.
Then I want a grouped comparison across three experiments. I switch to a multiple variables table, pull in the calculated concentrations, and let Prism order the groups the way I need them for the figure — treatment A, treatment B, vehicle. The categorical ordering in 11.1.0 means I don’t have to relabel the graph by hand afterwards.
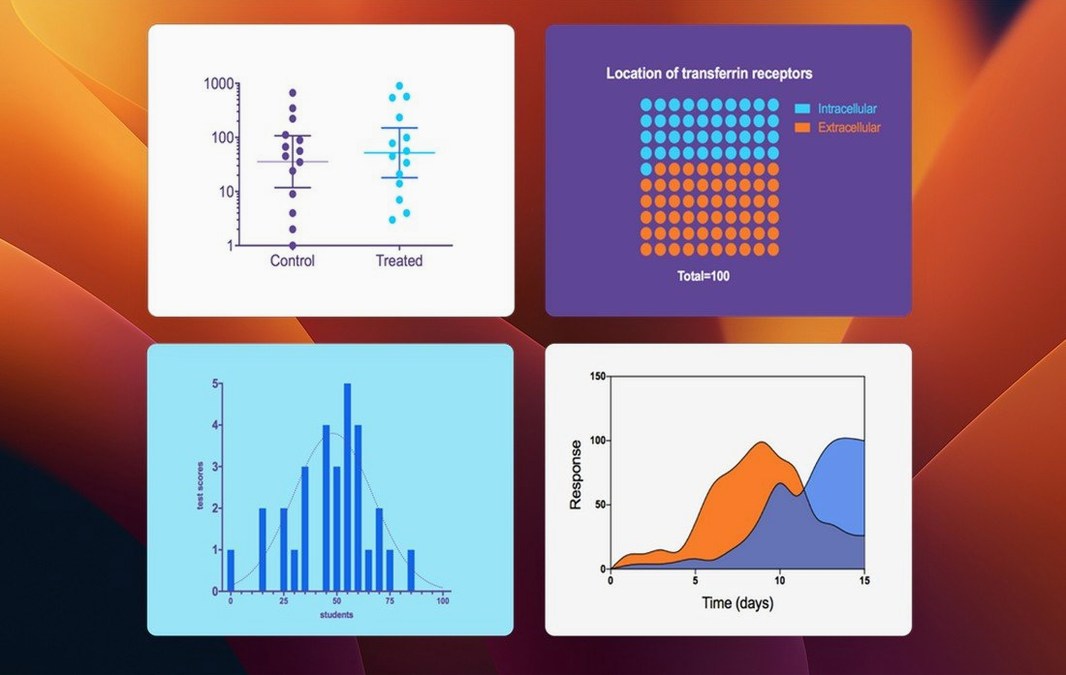
I pick a box-and-whisker plot, adjust the axis title from “Concentration” to “Concentration (ng/mL)”, and run a one-way ANOVA with the right post-hoc test. The results sheet gives me the table I’ll copy into the manuscript, and the graph looks clean enough to drop into the figure draft. I save, close, and go make tea.
That’s the rhythm of Prism after a while: table in, analysis run, graph checked, results noted. The software gets out of the way once you know where everything lives. If you’re still deciding whether it fits your work, a graphpad prism free download mac search will bring up plenty of places to read more before you commit. Some people look for a graphpad torrent or a graphpad prism crack out of habit, and if you go that route just be sure to verify the build’s integrity and set up a sandboxed environment so the app runs well. Even a prism torrent can settle into a smooth workflow once you’ve confirmed the analysis engine is intact.
Version 11.1.0 is mostly about making existing analysis work feel less fiddly:
- New graph types for multiple variables tables.
- Categorical level ordering for multiple variables data tables.
- Streamlined variable selection in analysis dialogs.
- macOS 11 or later
- Apple Silicon or Intel 64-bit Mac
- Interface language: English
Questions from the stall
Does GraphPad Prism run on Apple Silicon Macs?
Yes, version 11.1.0 supports both Apple Silicon and Intel 64-bit Macs.
What macOS version does GraphPad Prism 11.1.0 require?
It requires macOS 11 or later.
Is GraphPad Prism available for Windows?
Yes, GraphPad Prism is available for both Windows and Mac.
Notes from other shops 0
Sign in or open a shop account to leave a note.
No notes yet. If you've used this on a shop Mac, tell me how it went.