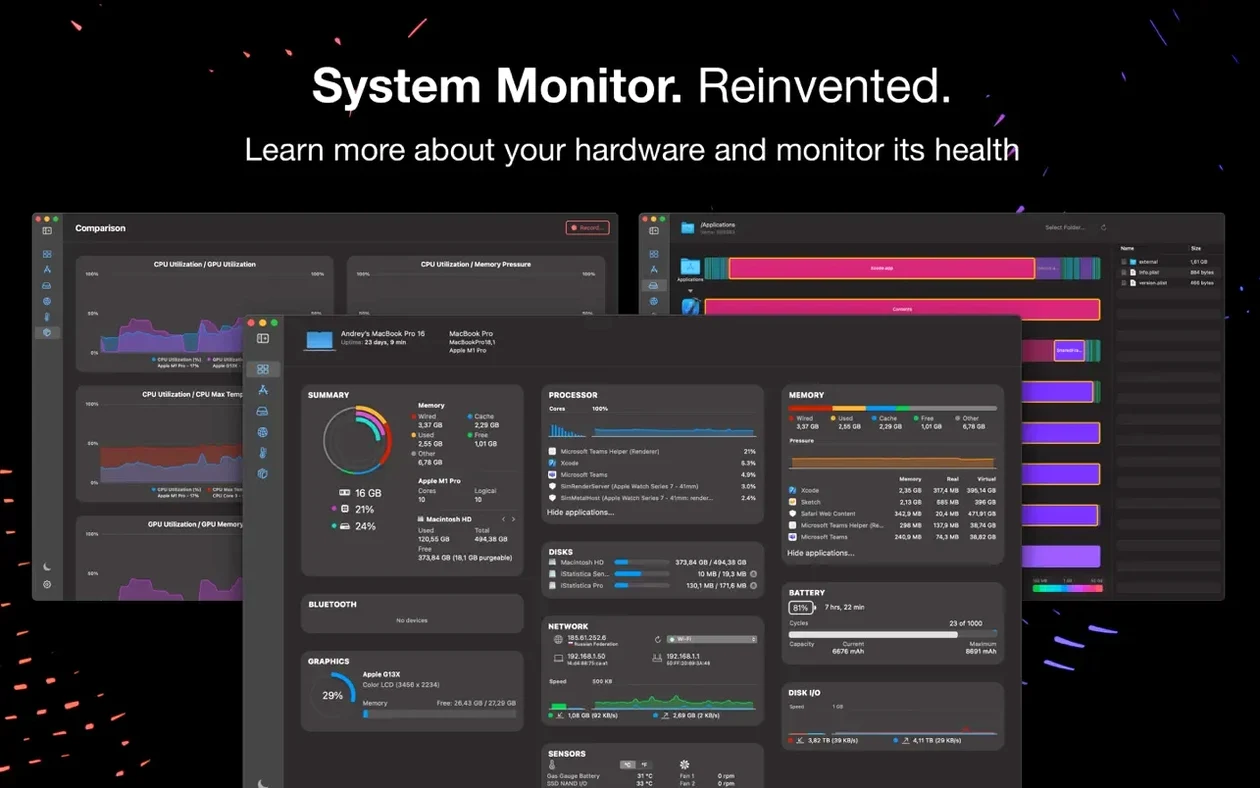
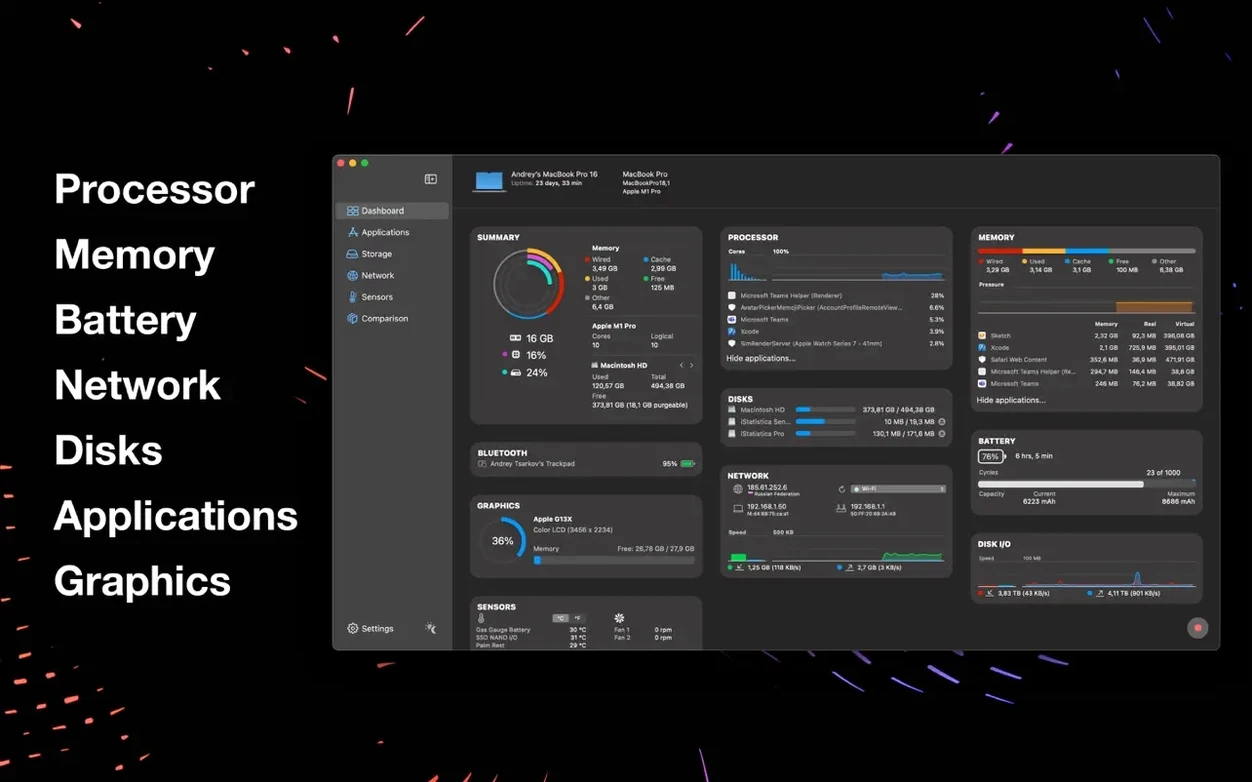
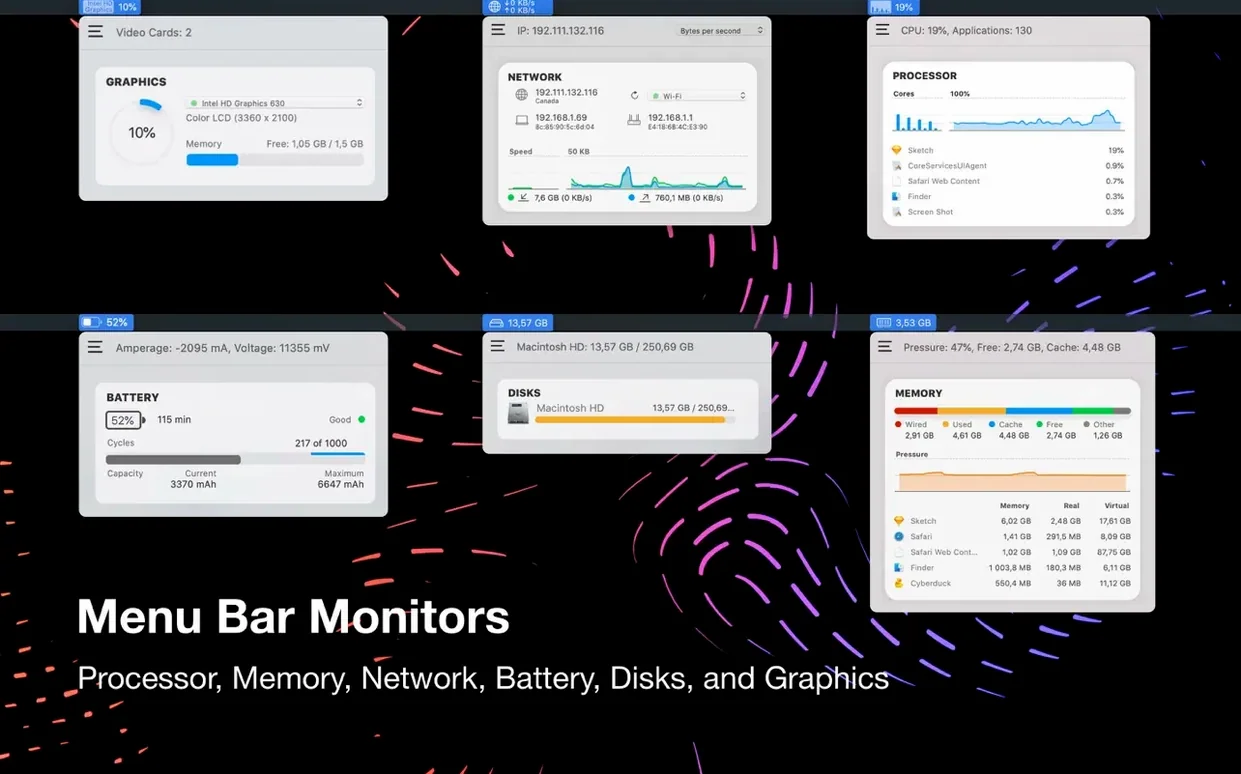
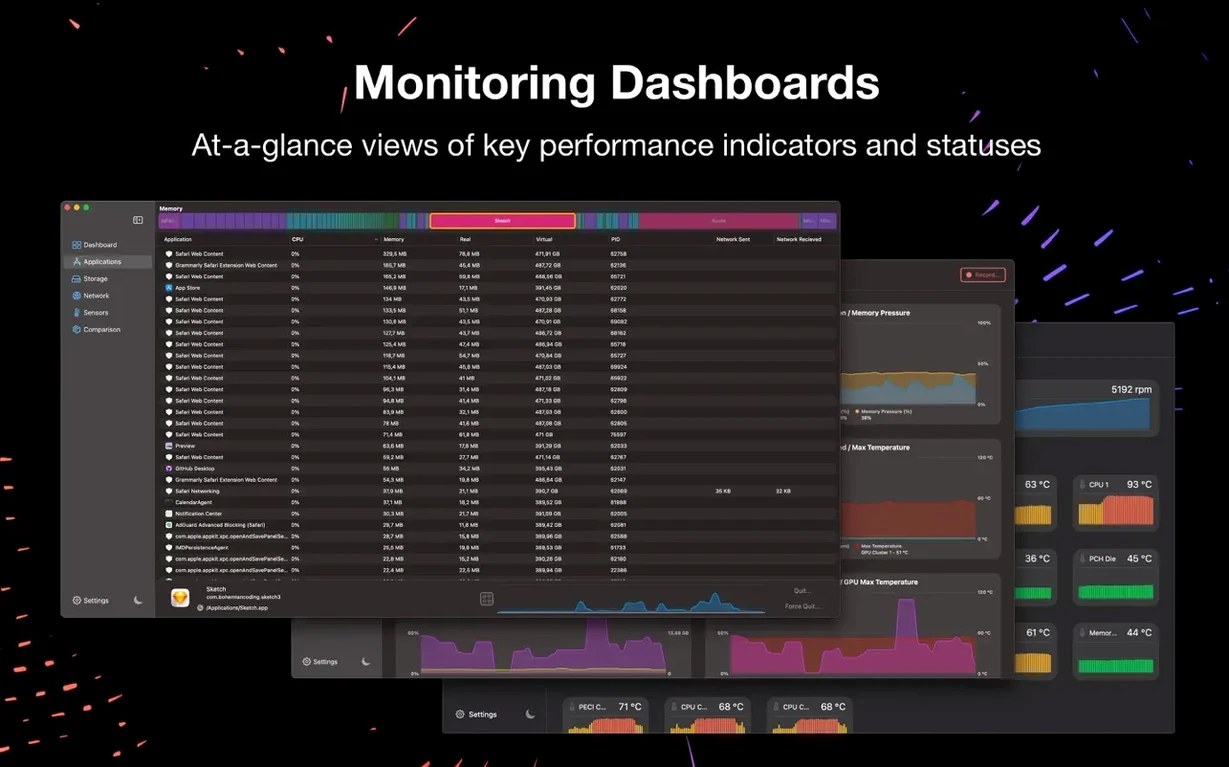
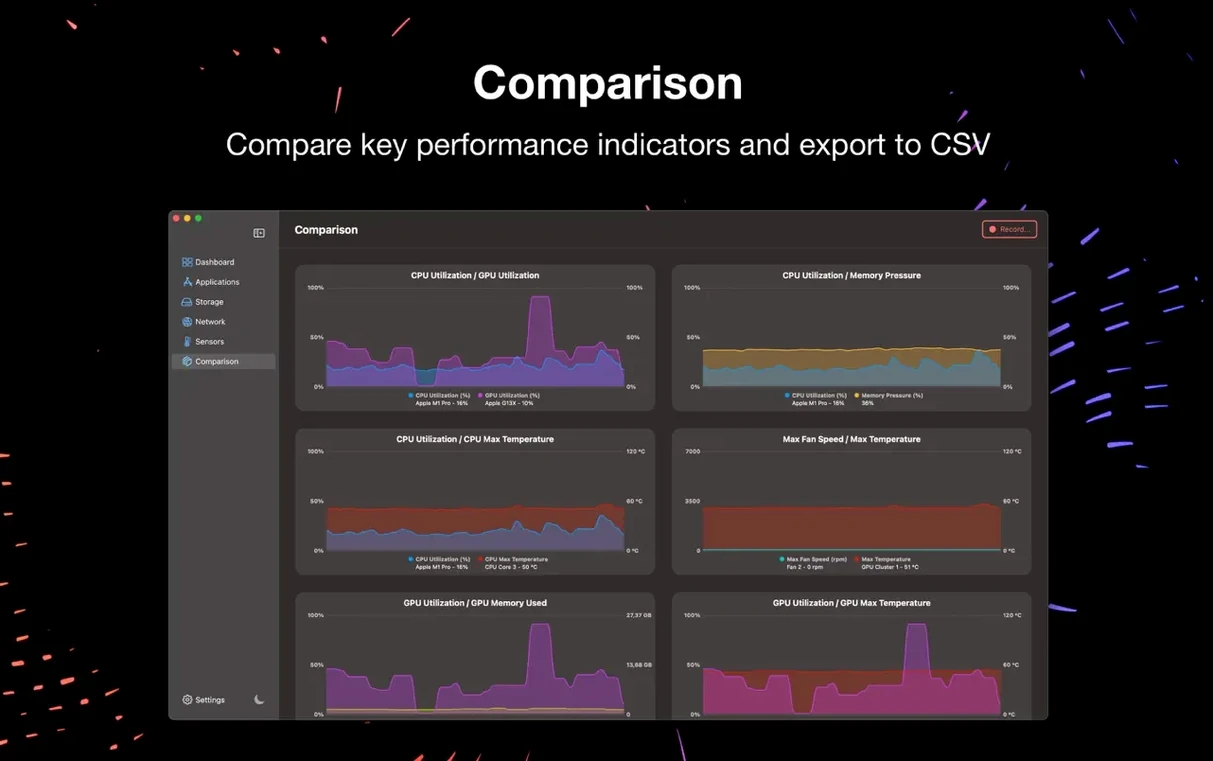
The menu bar icon can show four live readings at once. Battery, CPU, memory, disk, network and sensor stats are all one click away.
Memory pressure — the colored graph that tells you whether your Mac is handling its current workload or begging for more RAM. Green means it's fine, yellow means it's working hard, red means you need to close something.
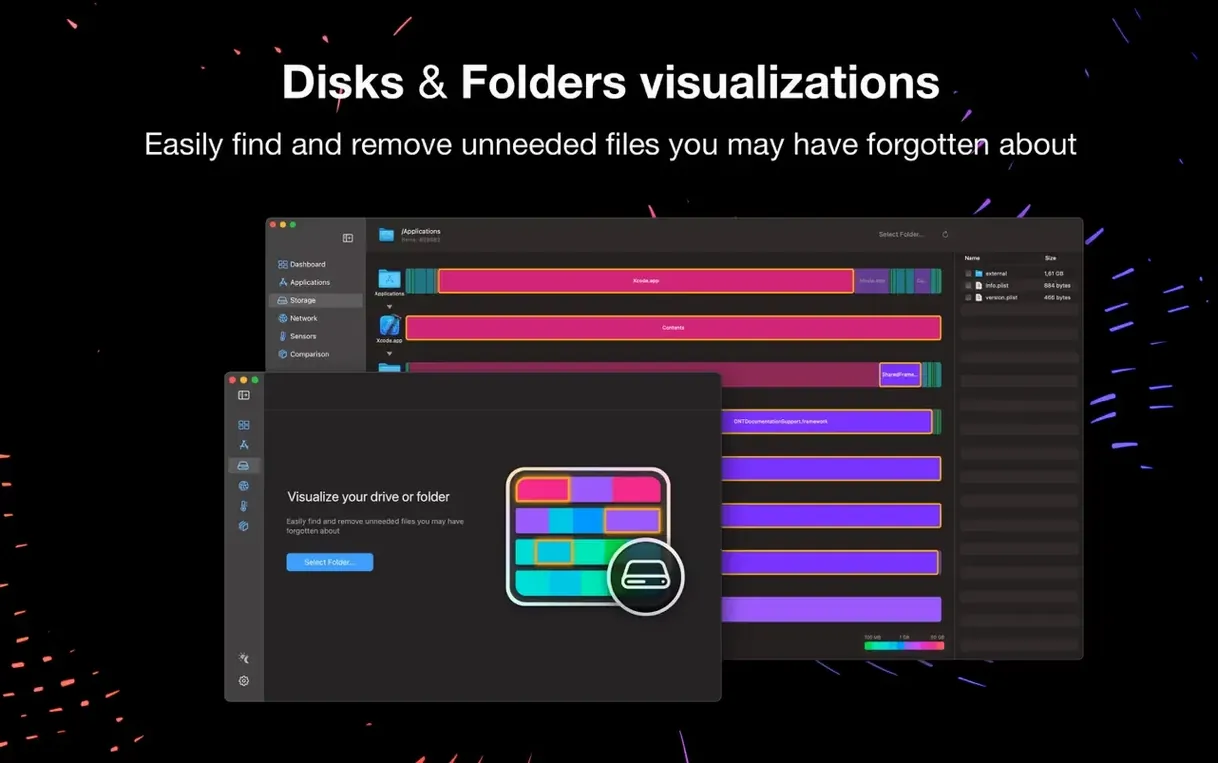
Storage visualization — a treemap that shows which folders eat the most space. Much faster than hunting through Finder. The Pro edition adds folder and drive visualization modules so you can spot space hogs before the "disk full" warning appears.
Network interfaces panel — lists external, gateway, and local IP addresses. Also shows speed and data rate charts for whatever connection you're on. Useful when you're troubleshooting why the shop Wi‑Fi feels sluggish during a backup.
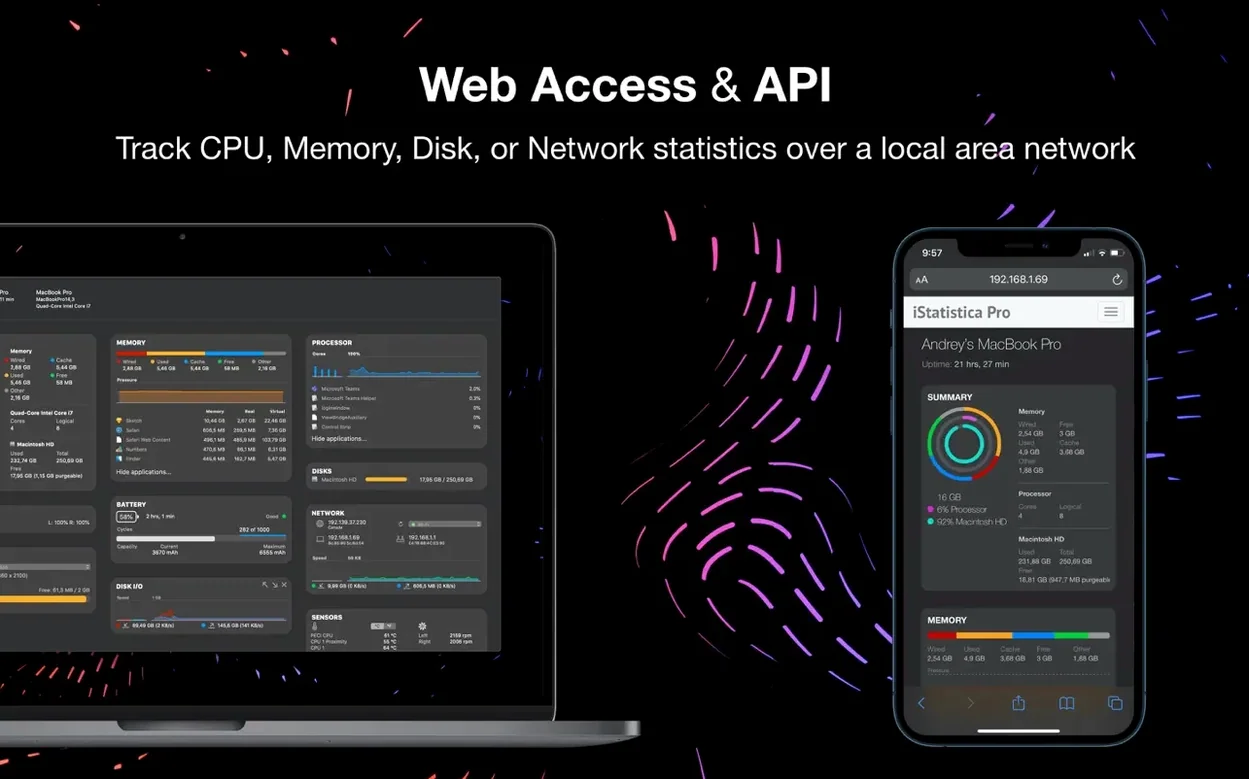
Web access — turns on a local web panel for tracking CPU, memory, disk, and sensor stats from any device on the network. You can keep an eye on your shop Mac from the iPad at the counter without walking back to the office.
Settings I'd change right after installing
The defaults are sensible, but a few tweaks make it feel more like your own tool. First stop: the menu bar section of preferences. Pick the four readings you actually glance at daily — I drop network speed and keep CPU, memory pressure, a temperature sensor, and battery time remaining. The icon gets less noisy that way.
Next, check the web access tab. It's off by default, and the port is set to a random number. Give it something you'll remember (like 8888) and set a quick password so the panel isn't wide open on the local network. Takes twenty seconds and saves a headache later.
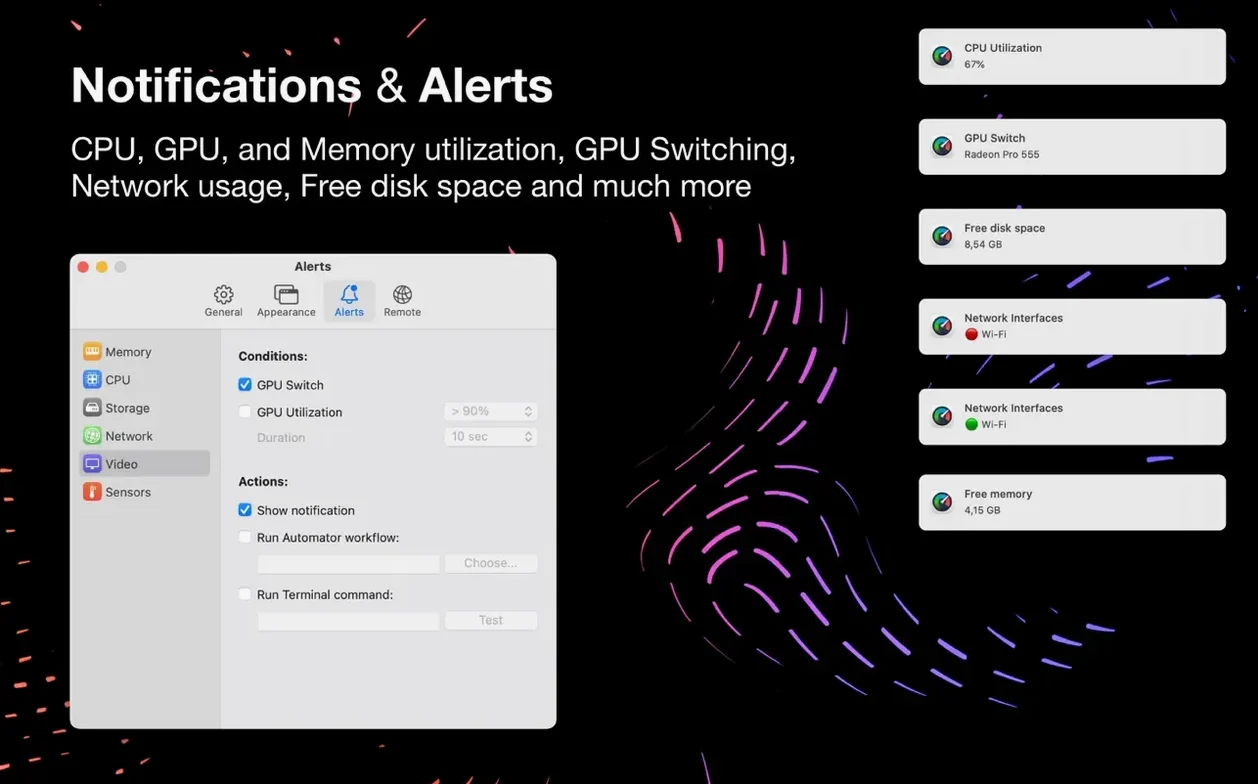
Under notifications, I'd raise the CPU temperature threshold a few degrees from the default. Macs run hotter than people expect, and you don't want alerts firing every time you render a video or export photos. Set it to warn you at genuinely concerning levels, not normal working temps.
Checking a network Mac’s vitals from your own desk
This one clicks best for two kinds of Mac users. First, people running a small shop or studio with a few Macs on the same network. The web access panel means you can check whether the back-office iMac is thrashing its disk while you're out front processing a sale. No separate server app, no terminal commands — just a browser tab on your phone or iPad.
Second, Mac owners with older machines who want to stretch their hardware a little further. The memory pressure graph and CPU history chart show exactly when the machine starts struggling. You can see whether that beachballing moment is a RAM shortage or a background process spiking the processor, then act accordingly instead of guessing. The disk cleanup tool ties into that nicely — it's not a deep cleaner, but it spots the obvious space wasters fast.
If you're the type who likes to glance at a number and understand what your Mac is doing right now, rather than waiting for it to misbehave, the real-time sensors and charts earn their spot in the menu bar pretty quickly.
Tip: The simple file search tool finds large forgotten files across your drives. Start there before buying more storage.
Version 7.1.3 adds an Apple Silicon Profiler and fixes a few compatibility issues that had been tripping up newer macOS setups.
- macOS 10.11 or later
- Apple Silicon and Intel Macs
Questions from the stall
Can I check my Mac's stats from another device?
Yes. iStatistica Pro provides web access so you can view CPU, memory, disk and sensor statistics from any browser on your local network.
Does it show battery information?
It does. Battery statistics like cycle count, health and charge level appear right in the app, and you can pin them to the menu bar.
Notes from other shops 0
Sign in or open a shop account to leave a note.
No notes yet. If you've used this on a shop Mac, tell me how it went.